3.2 Global Challenges for Energy Security
3.2.1 Global energy consumption (per capita)
Ritchie and Roser (2018) illustrated the energy use per person at the national level on the website “ourworldindata.org”. In general, the developed and energy-rich countries have the highest consumption per capita. The least developed countries, particularly in Africa, consume just a fraction of what is consumed by countries such as the United States of America, Canada, the United Arab Emirates, Kuwait, Qatar, Saudi Arabia, Iceland and Australia.
3.2.2 Energy consumption: historical and future trends
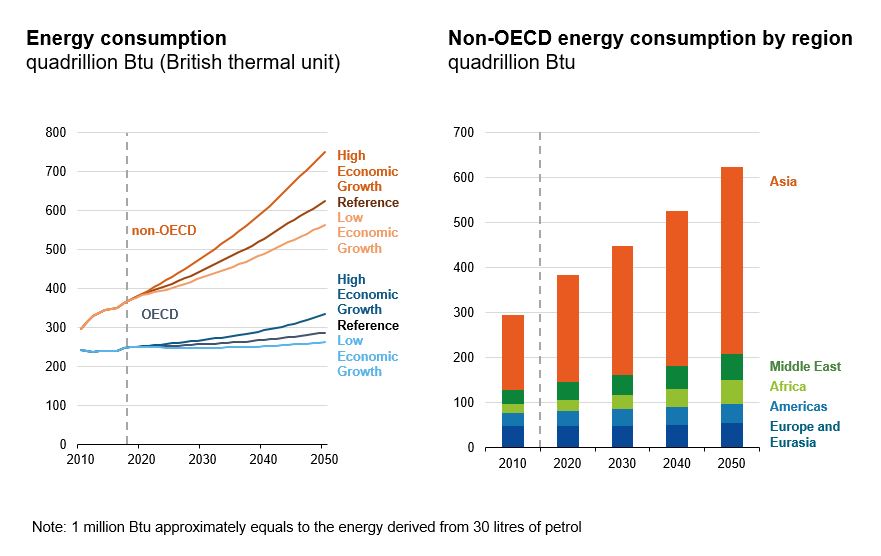
Source: International Energy Outlook 2019 (EIA, 2019)
The previous section displayed the energy consumption per capita in 2018. The two graphs presented here show both the historical increase and projected future increases in energy consumption. The first graph separates the world into OECD and non-OECD countries, highlighting that it is in the non-OECD countries where energy demands are expected to show a sharper increase in the future. The second graph further separates these non-OECD countries according to world region.
Note that these graphs should be considered in conjunction with the map presented on the previous section. The most developed countries still tend to consume significantly more energy per capita than less developed countries.
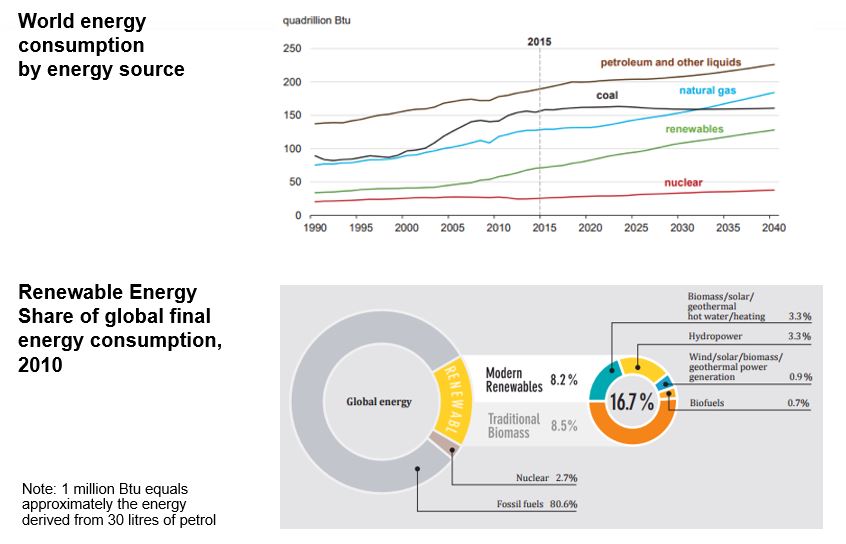
EIA, 2017; REN21, 2012
The top graph separates world energy consumption according to source, with historical data from 1990 to 2015 and predictions from 2015 to 2040 (EIA, 2017). Today approximately 80% of the total energy produced is derived from fossil sources. The projection suggests a levelling off of global coal use, and a pronounced increase in the use of renewable energies to fulfil the void left in projected global energy demand.
The second graph provides a breakdown of the different renewable energies that made up the global share of renewables in 2010 (REN 21, 2012). It is worth noting that the renewable share (16.7% at the time) was almost evenly divided into traditional biomass and what is termed “modern renewables”.
3.2.3 Global Total Final Energy Consumption by Sector (2018)
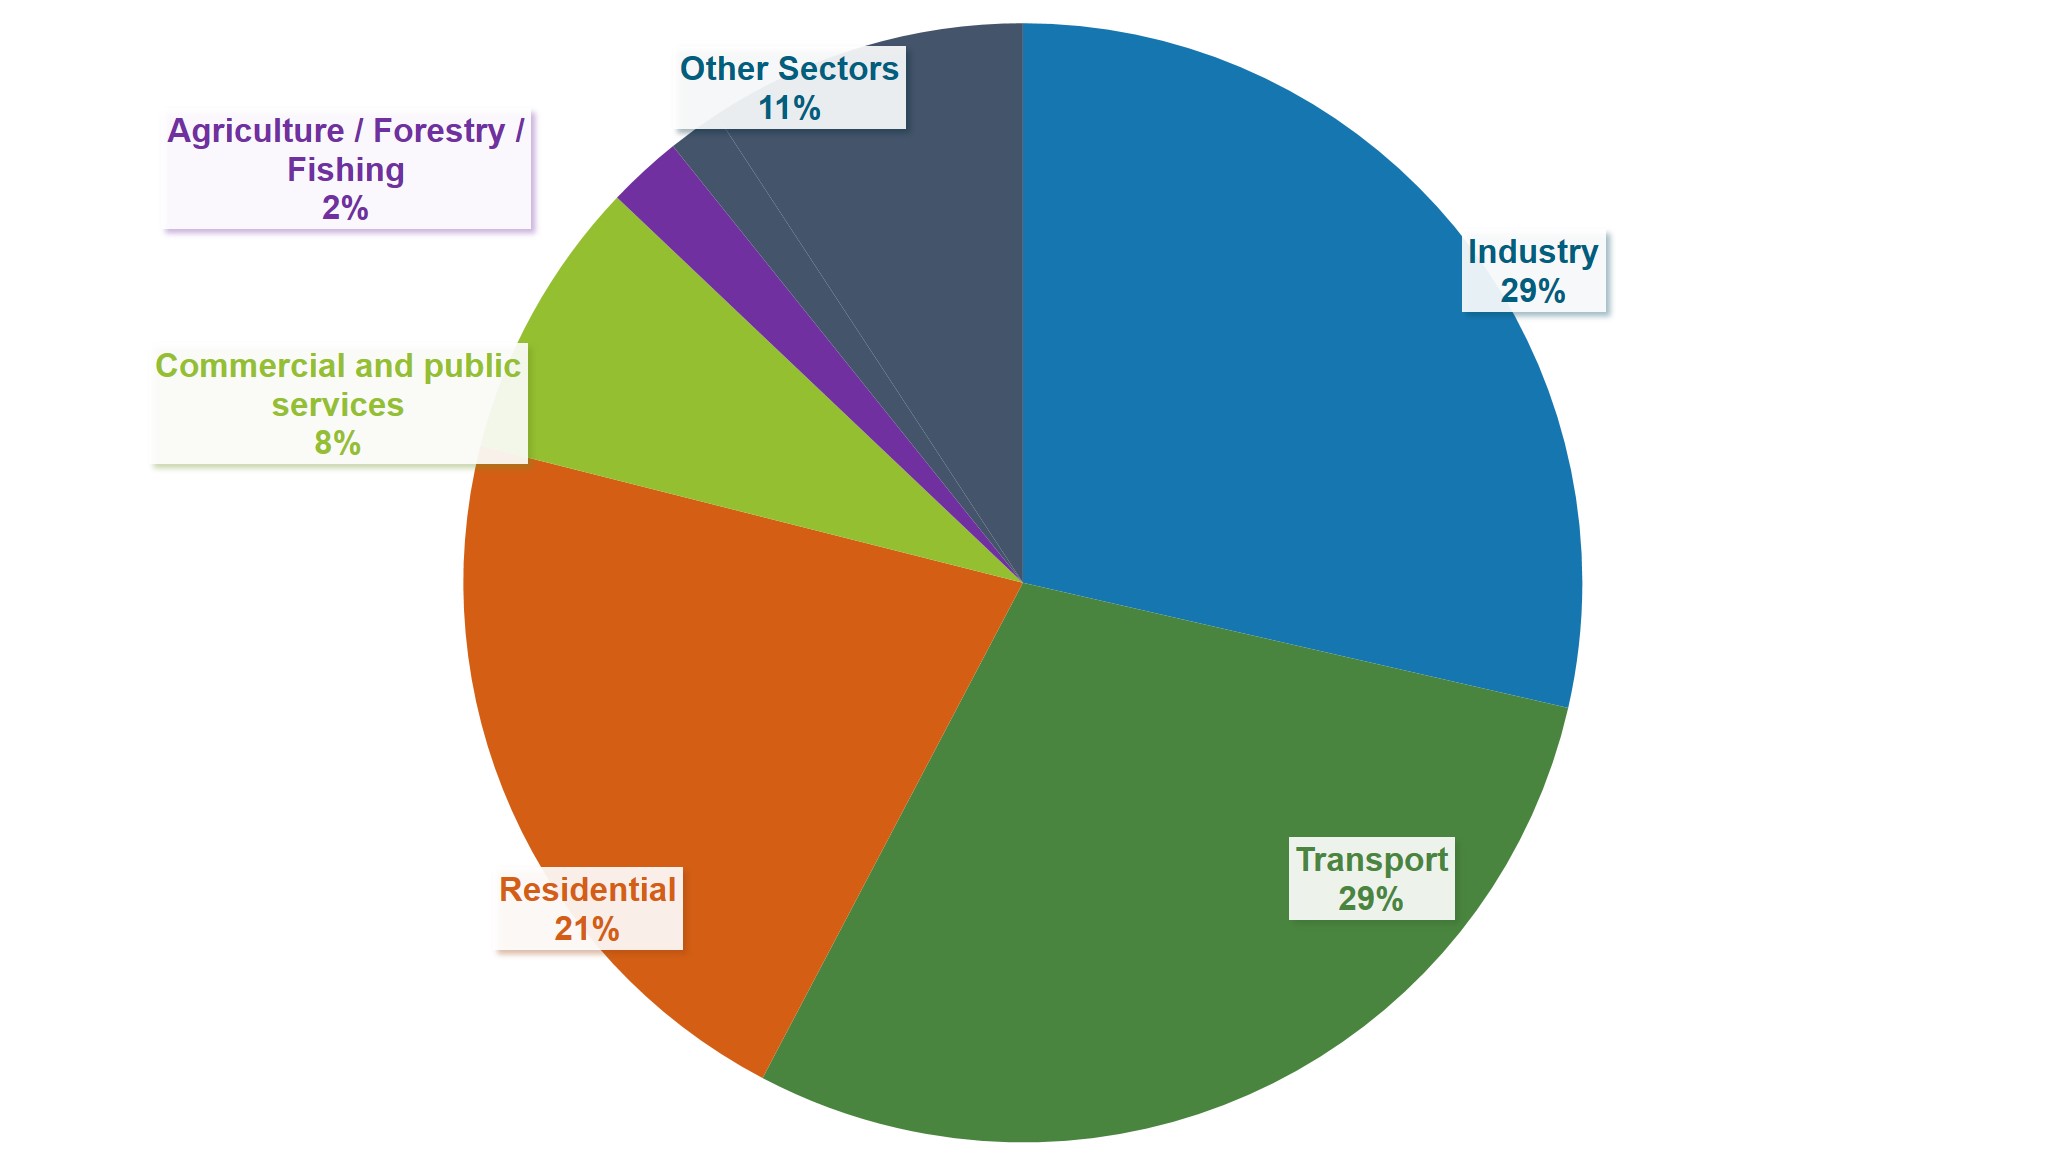
IEA (2020a)
This figure shows the distribution of global final energy consumption over different demand sectors. In 2018, World energy is used predominantly for industry (29%), transport (29%) and residential (21%) purposes.
Commercial, agriculture, forestry, fishing, non-energy and other uses account for 20% altogether (IEA 2020a). World energy production was 14.421 Mtoe in 2018. In general, the shares of individual sectors of the total global demand are not changing significantly from year to year.
3.2.4 Global Total Electricity Generation by Source and Renewable Share (2018)
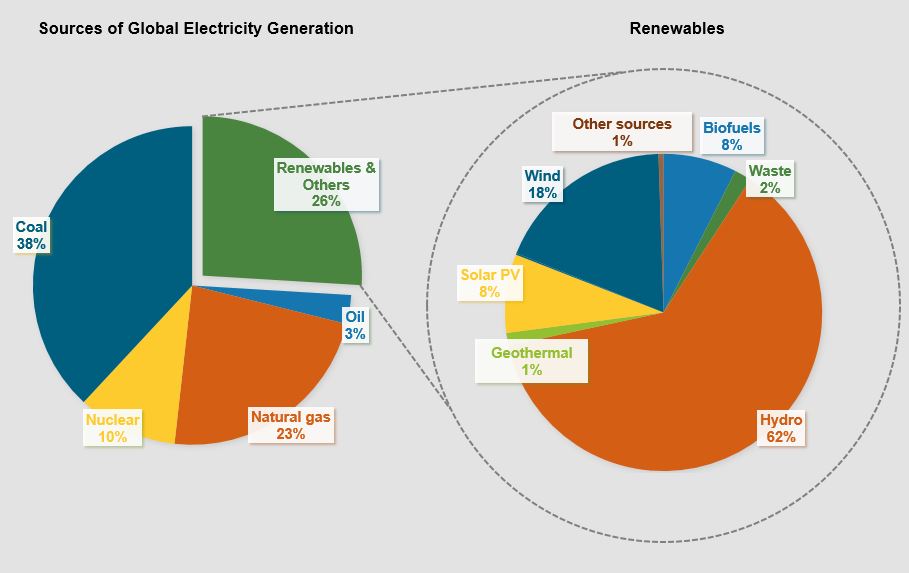
IEA (2020b).
Energy supply/consumption also needs to be subdivided by energy type: heating and cooling for thermal energy, electricity for electrical energy and mobility for kinetic energy (transport).
The term “electricity security”, refers to the supply security of electricity, so to speak, the energy flows which provide electricity to the end-users. The renewable share in global electricity generation was at 26% in 2018 (IEA 2020b). The most prominent renewable energy is hydropower account for 62 % of renewable global electricity production. Wind energy (18%), solar photovoltaics (8%) and biofuels (8%) account for a third of renewable electricity production. Further sources are waste, geothermal energy, tide, and other sources (all together 4%).
3.2.5 From Energy Source to Consumption: Energy Flows
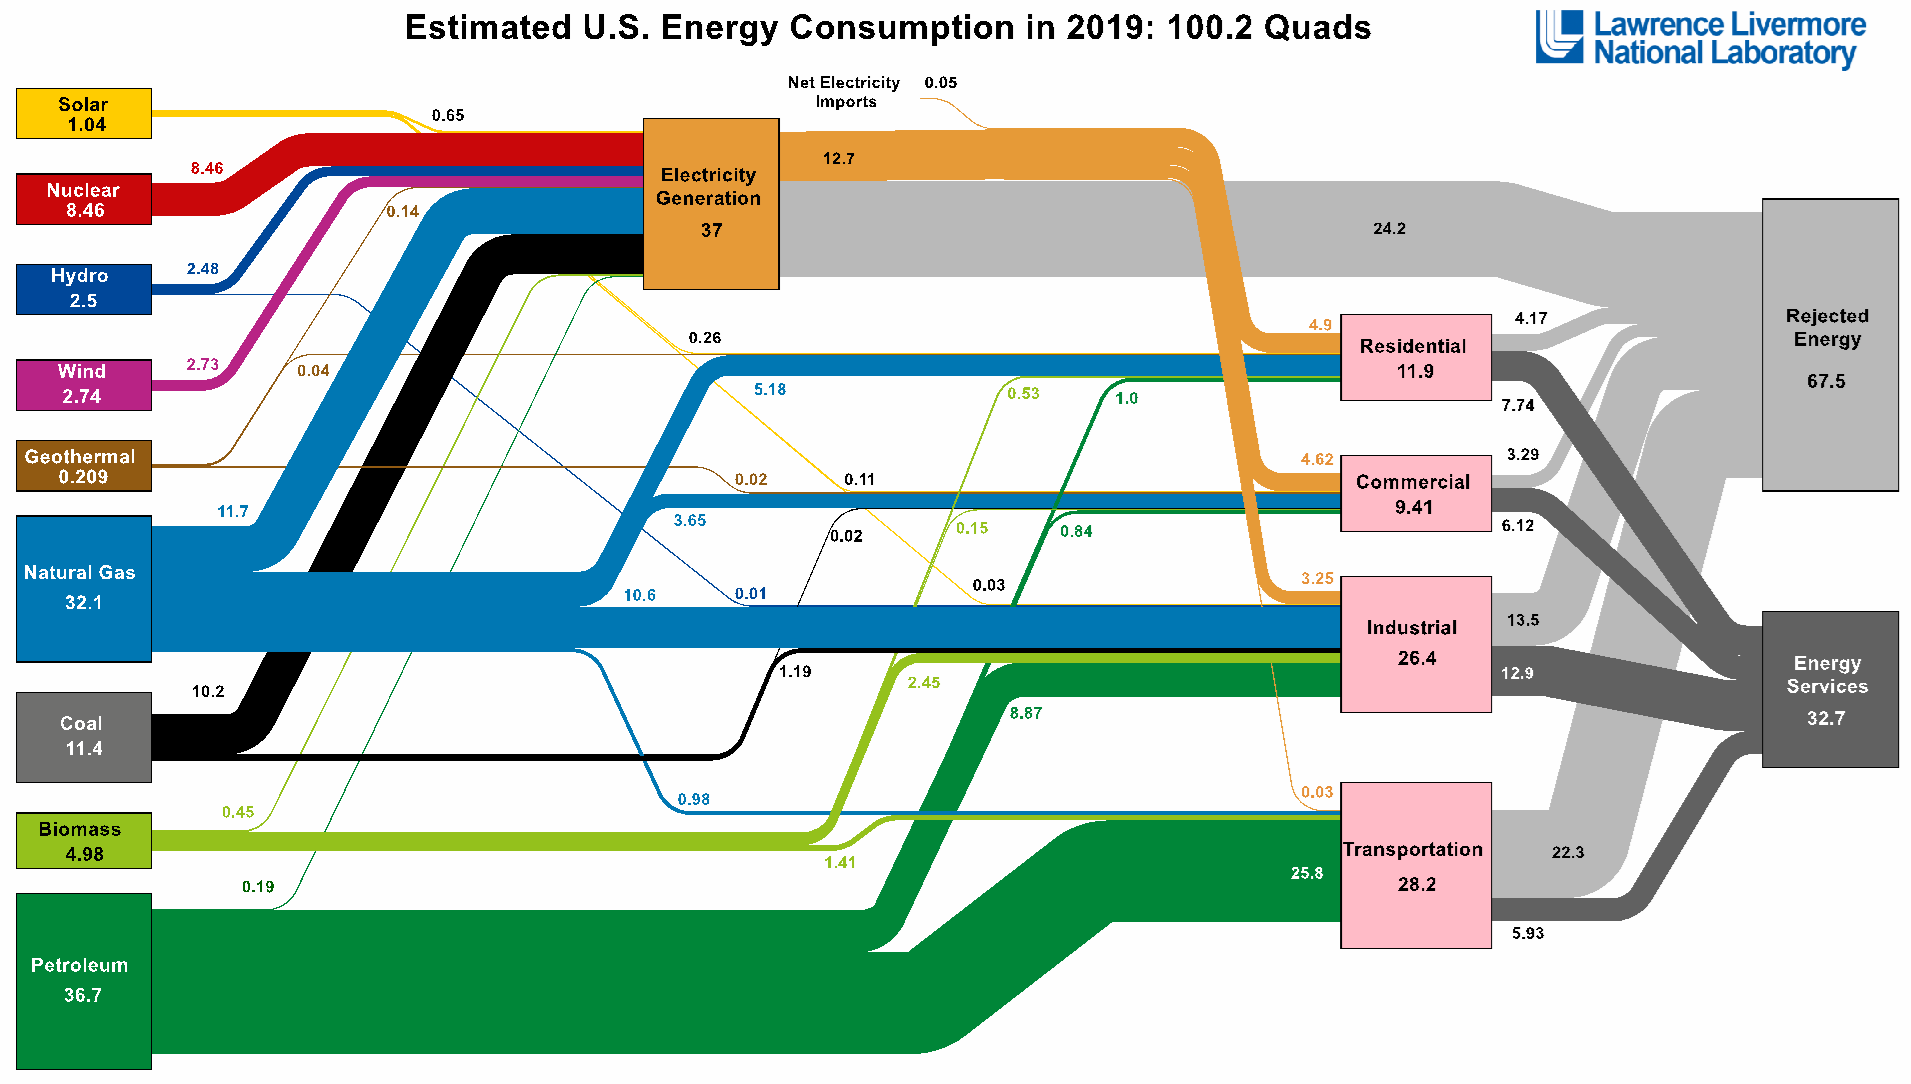
LLNC (2019).
National energy flow Sankey diagrams, illustrate the distribution of energy sources and uses by sector. The energy flow charts by Lawrence Livermore National Laboratory (2020) include solar, nuclear hydroelectric, wind, geothermal, natural gas coal, biomass, and petroleum. Energy is stored and transmitted as chemical energy (e.g. batteries, biomass, petroleum, natural gas, and coal) gravitational energy (e.g. hydropower), thermal energy (heat) and electrical energy (through wires, in capacitors). The section shows the example of the US in 2019 with a relatively high share of petroleum and natural gas as primary energy source. Also the Energy Flows of other countries are shown on the website of Lawrence Livermore National Laboratory (2020).
“Functions performed using energy which are means to obtain or facilitate desired end services or states” are termed “Energy Services” (Fell 2017). They can be allocated to the sectors residential, commercial, industrial, and transportation and include for example heating, cooling, cooking, lighting, and motive power (ibid.). Rejected energy is the energy lost due to conversion and transmission, mostly in the form of thermal energy (waste heat).
3.2.6 Electricity Availability: Power outages (blackouts) and their role in Energy Security
Power generation; does not equal a connective grid; does not equal access to power
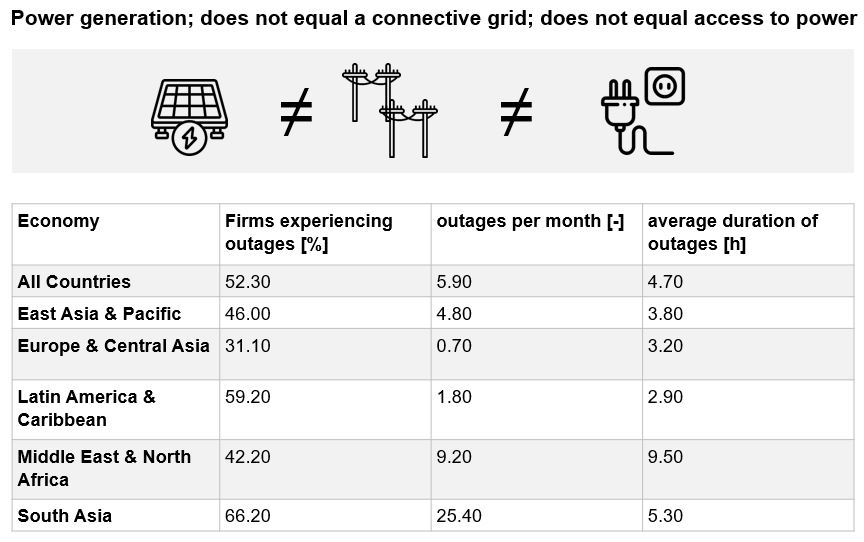
Rentschler et al., 2019.
The electrification rate is mostly assessed by the amount of households that are connected to the grid. This connection in itself however, does not guarantee a reliable service for the end users. Power outages are very common across the globe. An enterprise survey conducted by the World Bank, considering 143,000 firms from 137 countries, found that more than half of these firms experience regular power outages. (Rentschler et al., 2019)
As can be seen in the table, some areas experience very frequent outages, with some firms in South Asia having no power for up to over 100 hours per month.
3.2.7 The cost of power outages
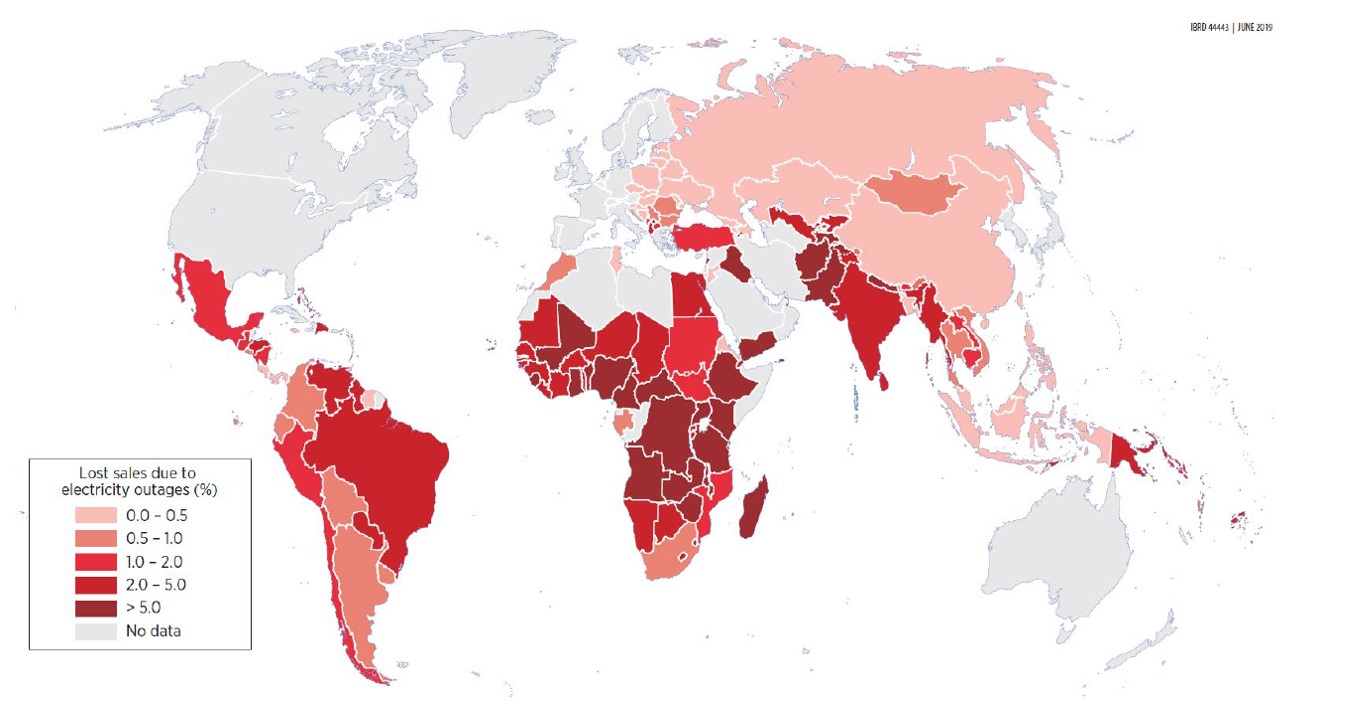
Rentschler et al., 2019.
The study also found that the outages come along with considerable costs for the economy of the considered countries. In total, the estimated losses from sales due to the outages of these firms make up for around $US 82 billion annually (Runtschler et al. 2019), not considering the costs for alternative electricity generation. The map shows where the costs are highest. In addition to these financial losses, the unreliable access to energy proved to be a major barrier for market entry, since backup generators are expensive and mostly not available to small firms. This restricts entrepreneurship and innovation, as well as external investments (Mensah 2018).
Investments in back-up power generators are opportunity costs that hinder further growth. In the case of Africa, increasing the frequency of power outages by one percent is projected to lead to a reduction of the GDP per capita by as much as 2.9 % in the long run (Runtschler et al. 2019). Apart from the cost on firms and enterprises, there are also direct effects of outages on the general population. Frequent outages in Ethiopia and Nigeria have been shown to increase criminality and cause a heightened sense of insecurity among the population. (Amadi 2015; Meles 2020).
The relation of outage frequency and the GDP
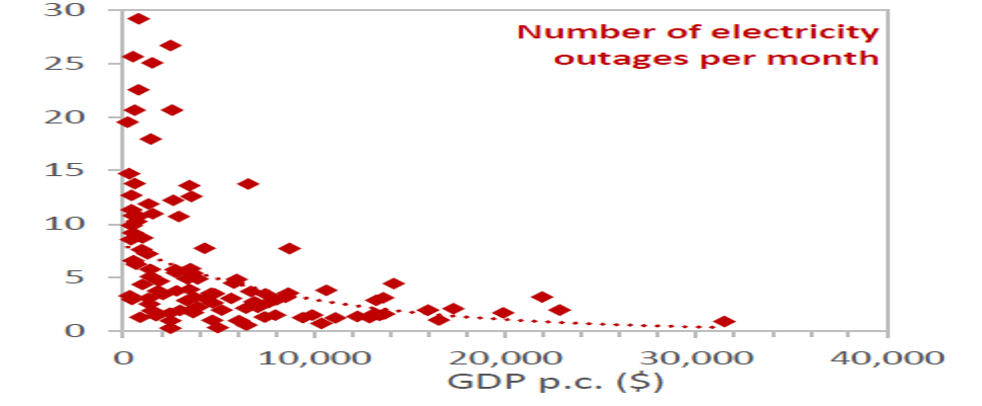
Rentschler et al., 2019.
While outages are common even in high-income countries, the frequency decreases with an increasing GDP, due to possible investments from the public sector in infrastructure (Runtschler et al. 2019). In developed countries, power outages usually happen due to external effects, namely natural causes (lightning, ice, trees falling into the power lines, wildlife triggering a short circuit); equipment failures; or public damage (vehicle accidents, unsafe digging or overhead construction and vandalism). (Epcor 2021; Entergy LLC n.d.)
While all of these can also happen in developing countries, the main reason here is the unreliable infrastructure, both in generation and distribution and thus the unstable supply of electricity from the grid. Most countries are severely lacking in adequate grid infrastructure due to missing public investments all in building, operating and maintaining a grid. (Fakih et al. 2020)
Approaches to solve frequent outages
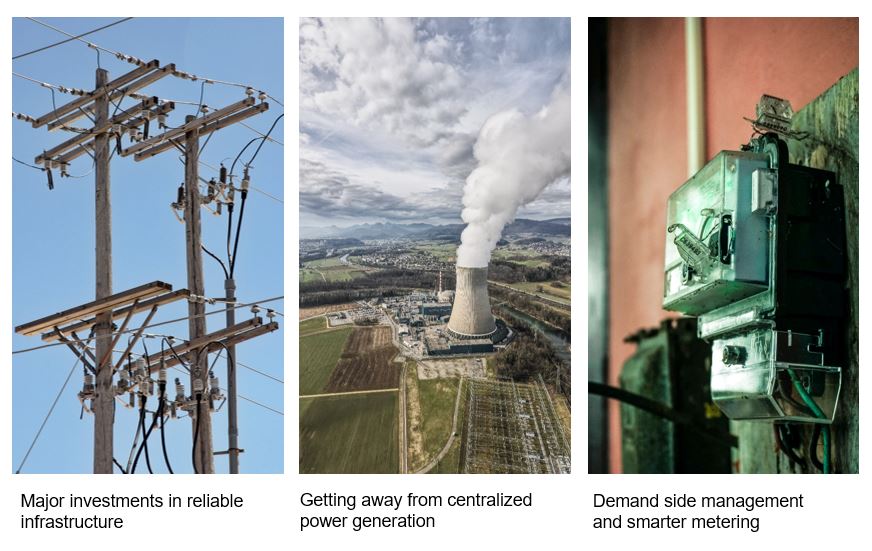
Images by (1) Robert Linder; (2) Patrick Federi and (3) rahul g on Unsplash.
To avoid outages, generation must be stable and the distribution system must be maintained properly. Fluctuations both in load and in generation have to be compensated, which requires back-up generation. A reliable grid infrastructure is achievable only through efficient investments from the public sector. Since lowincome countries already spend a higher percentage of their GDP on infrastructure, the development of the private sector as well as aid from development partners are also needed (Gurara et al. 2018).
Another approach for the future is for developing countries to “skip” the centralized approach and further develop decentralized systems through micro generation. This could help to decrease the reliance on the public grid, while the financing is easier. Currently however, the costs for small systems are still too high and a connection to the grid is needed to secure a general energy supply in most regions (Levin and Thomas 2016).
Demand-side management (DSM) is also considered as a possible way to reduce outages and their negative effects. DSM describes the shifting of electric loads at the consumer’s side in order to reduce peak-demands and thus reduce pressures on the grid. While this is projected to significantly decrease the duration and the costs of outages, it requires the use of network-controlled smart technology, which comes along with high initial investment costs (Closepet 2013; Natarajan and Closepet 2012).
3.2.8 Acceptability – death rates and greenhouse gas emissions related to energy production
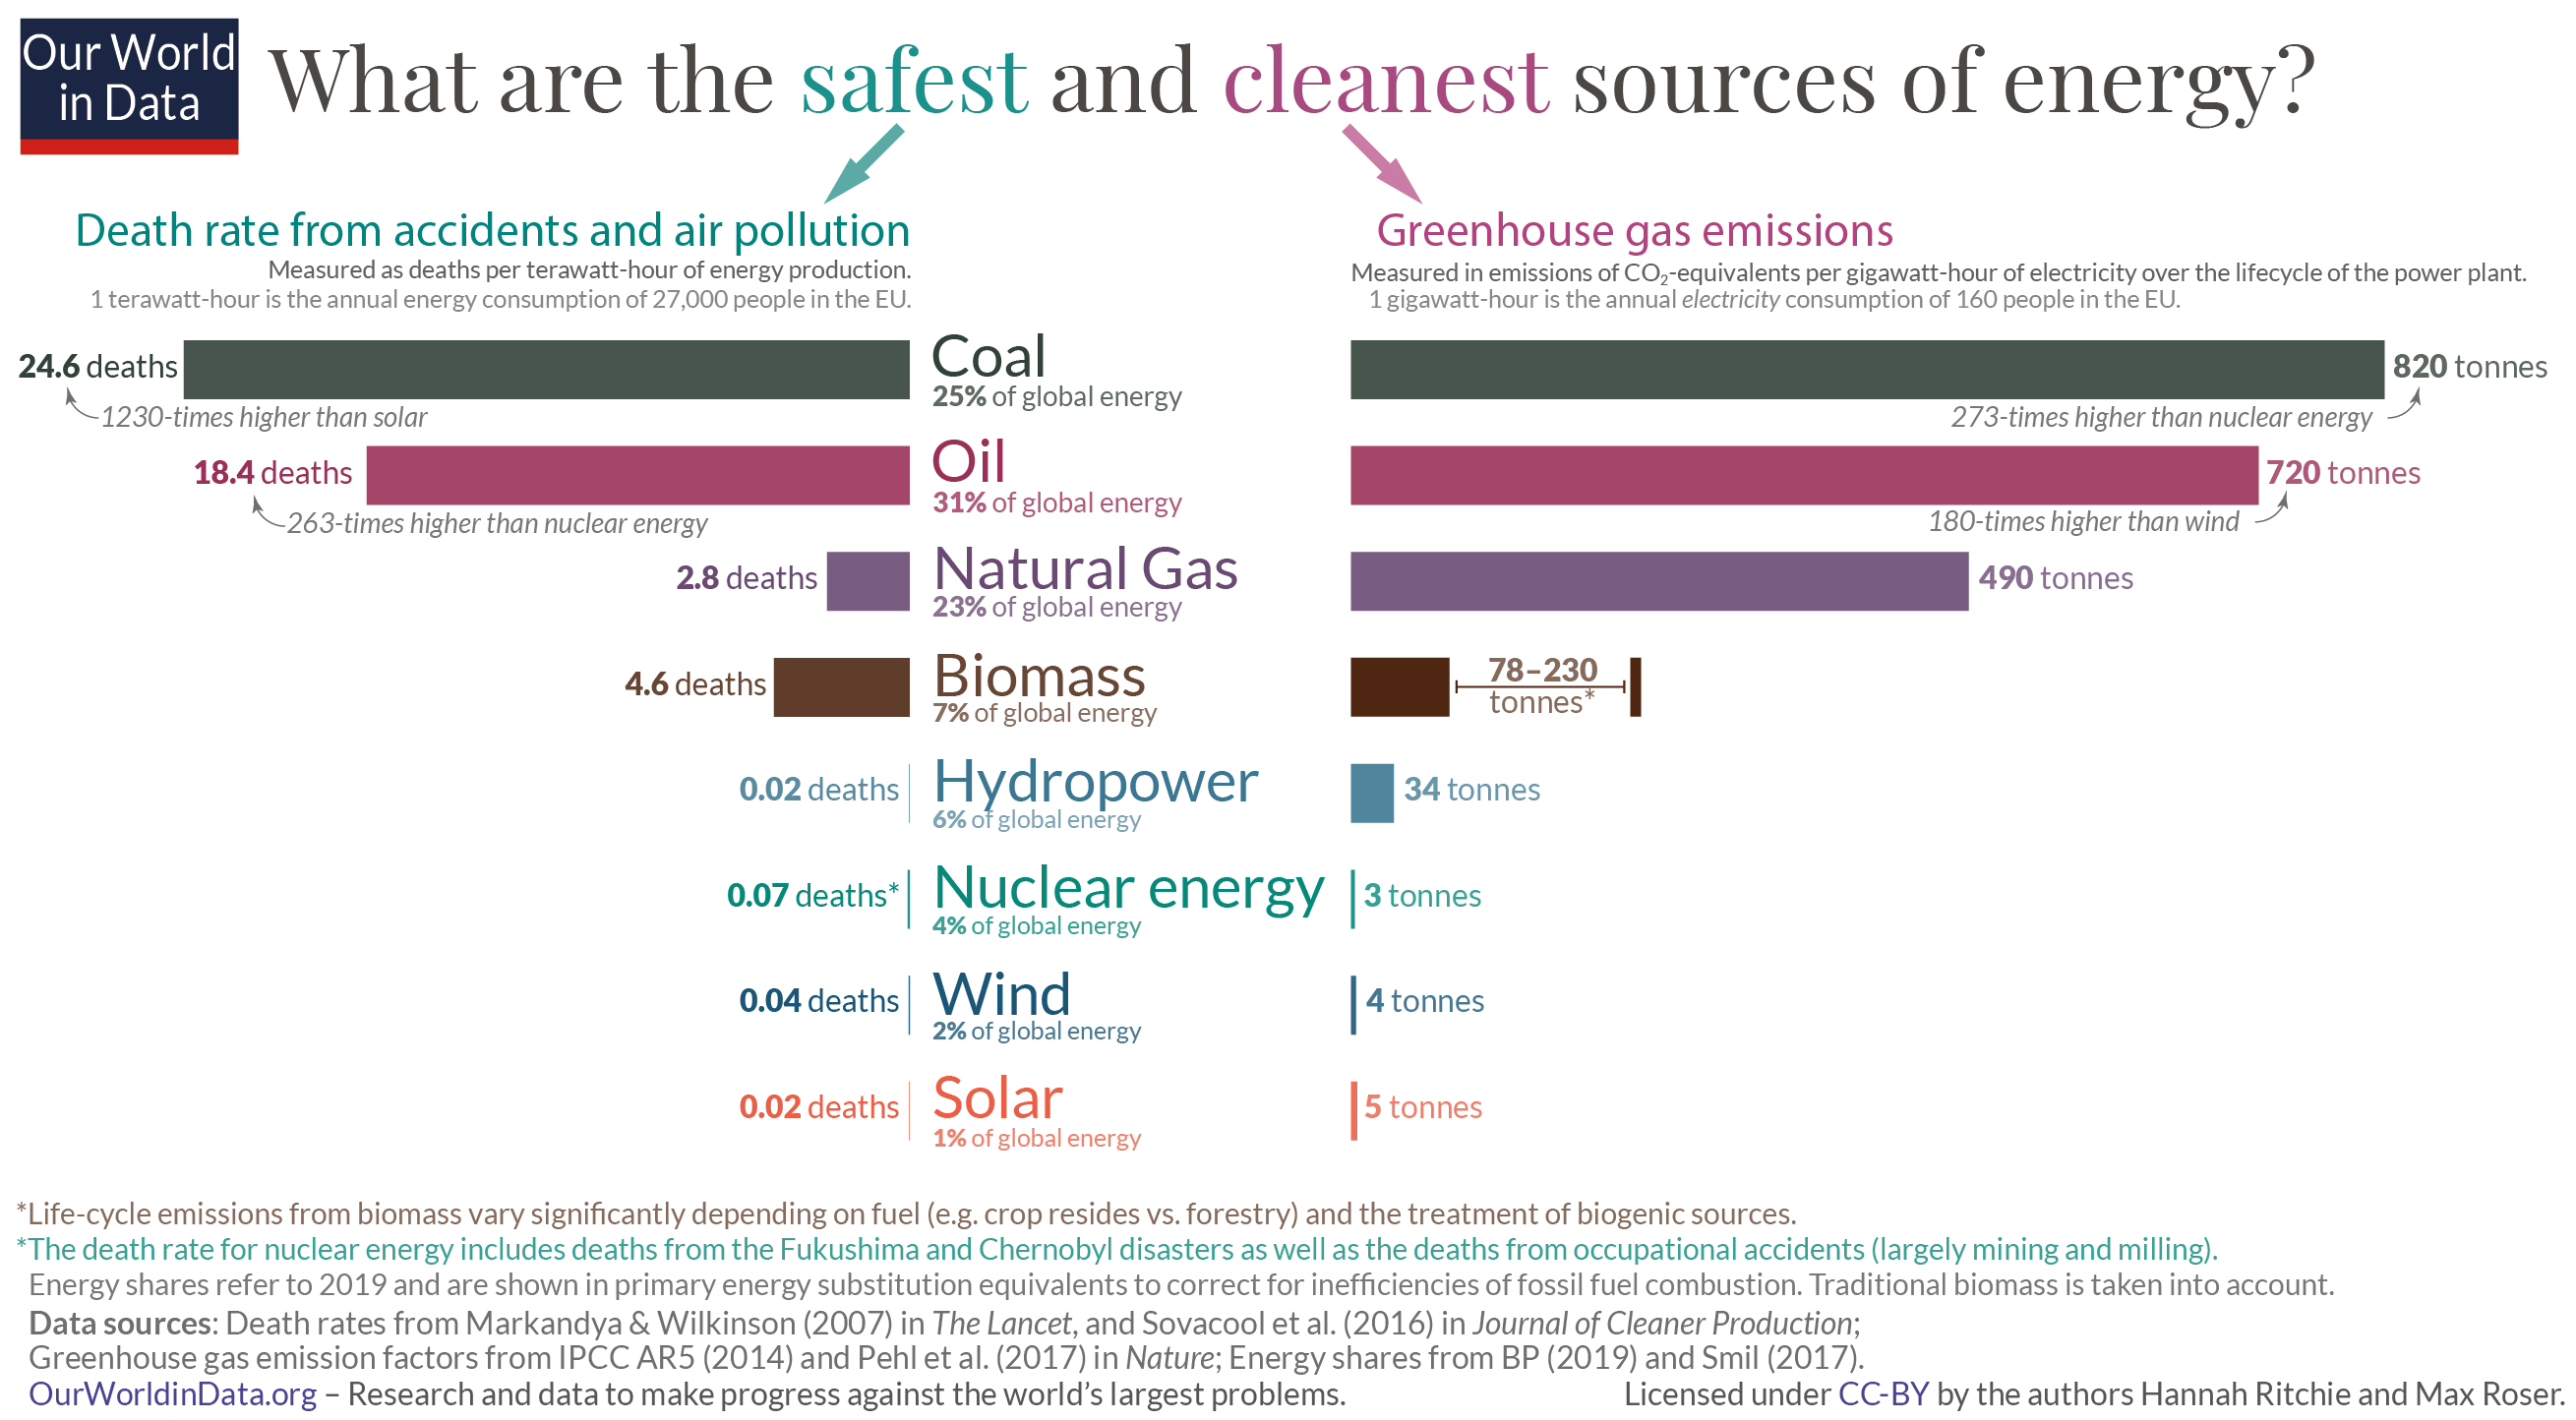
Ritchie & Roser (2018).
Every form of energy comes along with costs and risks. As can be seen in this graph, the actual impacts both on human health and on the climate differ wildly between different technologies. Conventional energy sources, namely coal and oil, are unfavourable in both aspects. The emissions per TWh from a coal plant are 162 times higher than from solar generation. The death rate is 1,230 times higher.
Renewable energies and nuclear power are less dangerous and by far have a lower impact on the environment. Biomass refers to both modern and traditional biomass, the latter having much higher impacts on human health and the environment. Including biomass, the low-emission technologies account for 20% of the global energy supply.
The death rates per TWh include deaths from accidents (e.g. in mines) and from respiratory diseases that are caused by air pollution. In all coal, oil, natural gas and biomass the deaths caused by air pollution dominate. In total, they make up for 5,000,000 to 8,000,000 deaths per year, depending on the study. In biomass in particular, most causalities are found in countries of lower-income, where traditional biomass is used for indoor cooking.
References
3.2 Global Challenges for Energy Security
-
Amadi, H. (2015): Impact of Power Outages on Developing Countries -Evidence from Rural Households in Niger Delta, Nigeria. In Journal of Energy Technologies and Policy (Vol. 5, Nr.3), pp. 27–38.
-
Closepet, S. Amit (2013): Multi-Layer Optimization for Load Scheduling to Manage Unreliable Grid Outages in Developing Countries. In EPE 05 (04), pp. 1053–1059. DOI: 10.4236/epe.2013.54B201.
-
Epcor (2021): Main causes of power outages. Available online at https://www.epcor.com/outages/power-outages/Pages/power-outagecauses.aspx, checked on 10/13/2021.
-
Fakih, Ali; Ghazalian, Pascal; Ghazzawi, Nancy (2020): The Effects of Power Outages on the Performance of Manufacturing Firms in the MENA Region. In Review of Middle East Economics and Finance 16 (3), p. 965. DOI: 10.1515/rmeef-2020-0011.
-
Fell, Michael James (2017): Energy services: A conceptual review. In Energy Research & Social Science 27, pp. 129–140. DOI: 10.1016/j.erss.2017.02.010.
-
Gurara, Daniel; Klyuev, Vladimir; Mwase, Nkunde; Presbitero, Andrea F. (2018): Trends and Challenges in Infrastructure Investment in Developing Countries. In poldev (10.1). DOI: 10.4000/poldev.2802.
-
IEA (2020a): World Energy Balances 2020. Total Final Consumption by Sector. Available online: https://www.iea.org/data-and-statistics?country=WORLD&fuel=Energy consumption&indicator=TFCShareBySector
-
IEA (2020b): World Energy Balances 2020. Electricity generation by source. Available online: https://www.iea.org/data-and-statistics?country=WORLD&fuel=Energy supply&indicator=ElecGenByFuel
-
Lawrence Livermore National Laboratory (2020): Energy Flow Charts. Available online at https://flowcharts.llnl.gov/commodities/energy
-
Levin, Todd; Thomas, Valerie M. (2016): Can developing countries leapfrog the centralized electrification paradigm? In Energy for Sustainable Development 31 (1), pp. 97–107. DOI: 10.1016/j.esd.2015.12.005.
-
Mensah, Justice Tei (2018): Jobs! Electricity Shortages and Unemployment in Africa. World Bank Group.
-
Meles, Tensay Hadush (2020): Impact of power outages on households in developing countries: Evidence from Ethiopia. In Energy Economics 91 (3), p. 104882. DOI: 10.1016/j.eneco.2020.104882
-
Natarajan, V.; Closepet, S. Amit (2012): 2012 IEEE International Energy Conference and Exhibition (ENERGYCON 2012). Florence, Italy, 9 - 12 September 2012. Piscataway, NJ: IEEE.
-
REN21 (2012), ‘Renewables 2012: Global Status Report’, Paris.
-
Ritchie, H. “What are the safest and cleanest sources of energy?”, 2020, Our World in Data, accessible at https://ourworldindata.org/safest-sources-of-energy, last checked on 18.10.2021
-
U.S. Energy Information Administration (EIA) (2017), ‘International Energy Outlook 2017’, Available from: https://www.eia.gov/outlooks/ieo/pdf/0484(2017).pdf
-
U.S. Energy Information Administration (EIA) (2019), ‘International Energy Outlook 2019’, Available from: https://www.eia.gov/outlooks/ieo/pdf/ieo2019.pdf
-
U.S. Energy Information Administration (2020): What is energy? Forms of energy. Available online at https://www.eia.gov/energyexplained/what-is-energy/forms-of-energy.php
-
Rentschler, J.; Kronejew, M.; Hallegatte, S.; Brease J; Obolensky, M. (2019): Underutilized Potential - The business costs of unreliable infrastructure in developing countries. The World Bank. https://openknowledge.worldbank.org/handle/10986/31919