2.2 Different Concepts about how to assess water security
Global threats to human water security and river biodiversity
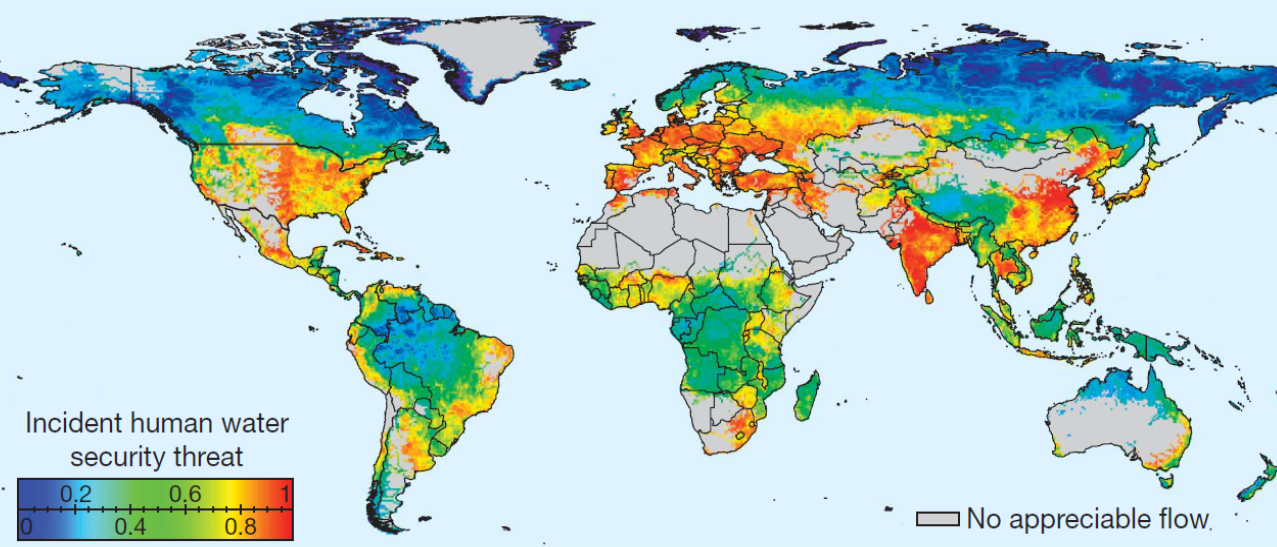
(Vörösmarty et al. 2010).
Vörösmarty et al. (2010) assessed human water security (HWS) and threats to biodiversity (BD). Drivers are the geographical representation of distinct stressors, and were selected to meet two requirements. First, drivers for which global-scale data sets of appropriate spatial resolution were either already available or could be generated in a defensible way from existing data were selected. And second, drivers whose chief mechanism of negatively impacting freshwaters was largely independent of the other drivers. A three-step procedure was used to convert driver values into standardized driver scores in order to calculate aggregate HWS and BD Threat indices. This conversion process allowed to account for downstream propagation of threats, normalize for longitudinal changes in discharge, and express all drivers on a common scale.
Four different themes were defined and for each theme important stressors identified (in total 23 stressors). The list is presented below with the respective weight in brackets:
Catchment disturbance (0.18):
(i) cropland (0.38)
(ii) impervious surfaces (0.28)
(iii) livestock density (0.20)
(iv) wetland disconnectivity (0.14)
Pollution (0.35):
(i) soil salinization (0.13)
(ii) nitrogen loading (0.14)
(iii) phosphorus loading (0.13)
(iv) mercury deposition (0.13)
(v) pesticide loading (0.15)
(vi) sediment loading (0.07)
(vii) organic loading (0.18)
(viii) potential acidification (0.05)
(ix) thermal alteration (0.02)
Water resources development (0.41):
(i) dam density (0.09)
(ii) river fragmentation (0.03)
(iii) consumptive water loss (0.34)
(iv) human water stress (0.26)
(v) agricultural water stress (0.19)
(vi) flow disruption (0.09)
Biotic factors (0.06):
(i) non-native fishes in % (0.13)
(ii) non-native fishes in % (0.14)
(iii) fishing pressure (0.27)
(iv) aquaculture pressure (0.46)
National Water Security Framework
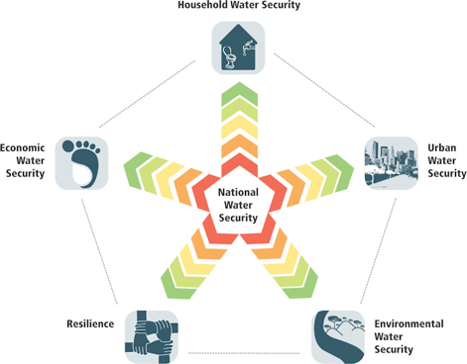
Asian Water Development Outlook (Asian Development Bank 2013).
The ADB (2013) applied a framework looking at five dimensions to assess national water security. The methodology has been applied for all Asian countries and here the main dimensions and indicators are presented. The scale used for national water security goes from 1 to 5 using the following qualitative interpretation: 1 = hazardous, 2 = engaged, 3 = capable, 4 = effective, 5 = model
The key dimensions (KD) are listed below:
KD1: Household water security
(i) access to piped water supply (%)
(ii) access to improved sanitation (%)
(iii) hygiene (age-standardized disability-adjusted life years per 100,000 people for the incidence of diarrhea
KD2: Economic water security
Agricultural water security subindex:
(i) productivity of irrigated agriculture
(ii) independence from imported water and goods
(iii) resilience (% of renewable water resources stored in large dams)
Industrial water security subindex:
(i) productivity (financial value of industrial goods relative to industrial water withdrawal)
(ii) consumption rate (net virtual water consumed relative to water withdrawn from industry
Energy water security subindex:
(i) utilization of total hydropower capacity
(ii) ratio of hydropower to total energy supply
KD3: Urban water security
(i) Water supply (%)
(ii) wastewater treatment (%)
(iii) drainage (measured as the extent of economic damage caused by floods and storms).
Adjustment factors are included to indicate impacts of the urban growth rate and river health.
KD4: Environmental water security
Watershed disturbance:
(i) cropland
(ii) imperviousness
(iii) livestock density
(iv) wetland disconnection
Pollution:
(i) soil salinization
(ii) nitrogen
(iii) phosphorous
(iv) mercury
(v) pesticides
(vi) total suspended solids
(vii) organic loads
(viii) potential acidification
(ix) thermal impacts from power plant cooling
Water resources development:
(i) dam density
(ii) river network fragmentation
(iii) relative water consumption compared to supply
(iv) agriculture sector water stress
(v) residency time change downstream from dams
Biotic factors:
(i) non-native species
(ii) non-native species richness
(iii) catch pressure
(iv) aquaculture
KD5: Resilience to water-related disasters
Exposure:
e.g. (i) population density
(ii) growth rate
Basic population vulnerability:
e.g. (i) poverty rate
(ii) land use
Hard coping capacities:
e.g. (i) telecommunications development
Soft coping capacities:
e.g. (i) literacy rate
Review on Water Security approaches for rural, remote or otherwise marginalized (RRM) communities
Review on Water Security approaches for RRM communities (Dickson et al. 2016).
Dickson et al. (2016) provided a literature review about water security related to rural, remote, or otherwise marginalized (RRM) communities. They evaluated, prioritized indicators for decision-making at local and supra-local scales. A list of indicators (n=176) was provided as an overview to select appropriate indicators depending on the dimension and on data availability.
Global Water Security Index- Measuring global water security towards sustainable development goals
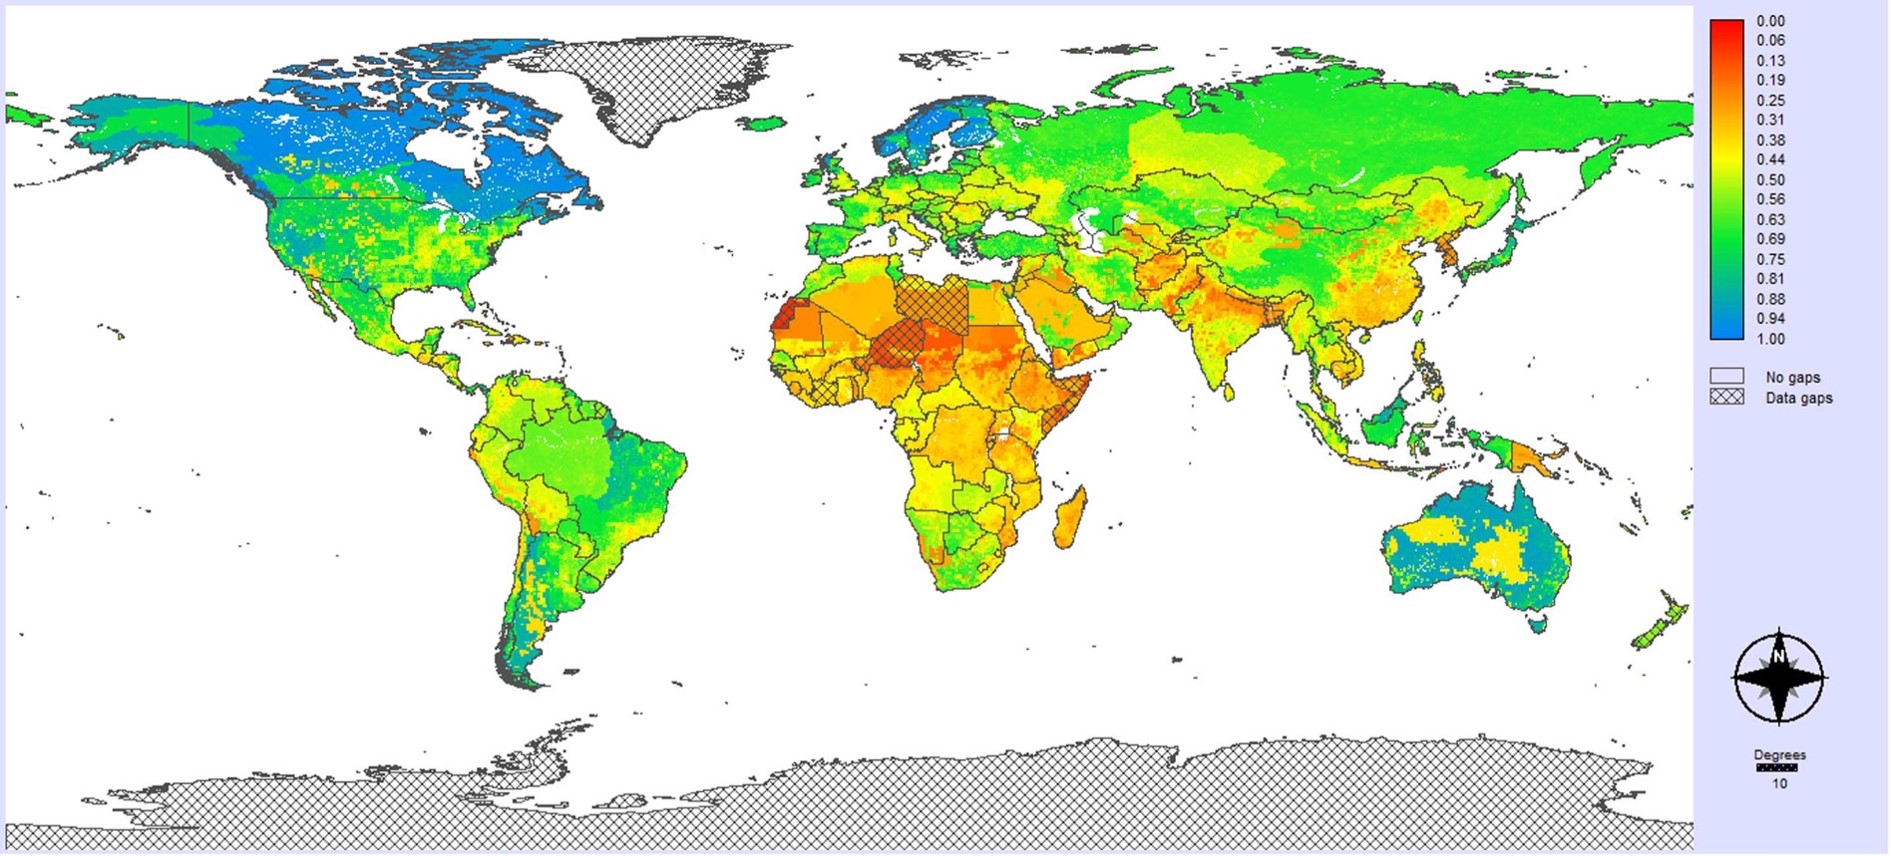
Global water security framework, based on water availability, accessibility, safety and quality and management (Gain et al. 2016).
Gain et al. (2016) developed a water security framework to provide a global understanding of the status of water security, using a spatial multi-criteria analysis (MCA) going beyond available recent water scarcity assessments. In their study, physical dimensions are mainly based outputs from the state of the art global hydrologic model PCR-GLOBWB at a monthly temporal scale that go beyond traditional assessment at yearly scale. The framework integrates physical and socio-economic dimensions of security within a unique index.
The world map shows the results of the aggregation of the different sub-indicators for the four dimensions. Since data at different scales were used, differences within some countries can be seen. The red areas show less water security while the blue ones show more water secure areas.
According to the authors, a quantitative assessment of water security should be carried out taking into account physical, socioeconomic and governance dimensions, through the assessment of indicators covering four main criteria: availability, accessibility, safety and quality, and management. The term, ‘security’ is considered as the output of spatial MCA and is decomposed into these four criteria.
Country examples of the Global Water Security Index
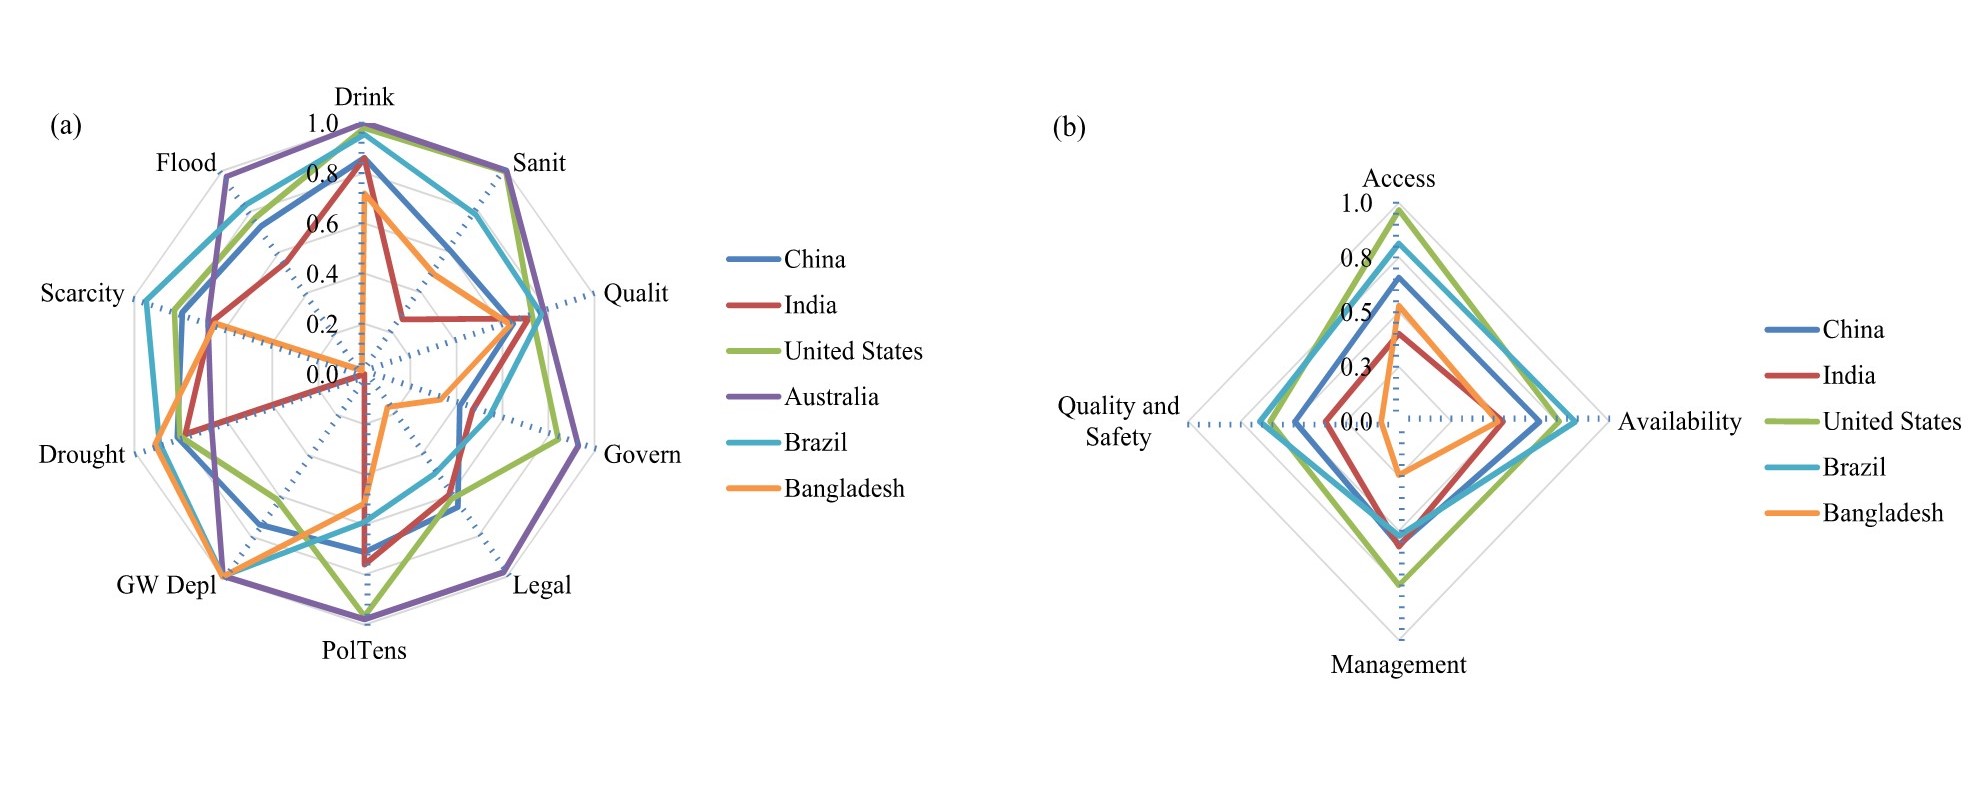
Spider Diagram showing water security for selected countries (Gain et al., 2016).
In this figure, examples for different countries can be compared according to the individual indicators (above) and the four defined dimensions (below). Below the selected indicators for each dimension are presented. The scale of data is mainly at a national scale:
Availability (0.5° spatial resolution):
water scarcity index, source: Wada et al. (2014)
drought index, source: Wada et al. (2013)
groundwater depletion, source: Wada et al. (2012)
Accessibility (country scale):
access to sanitation, source: Hsu et al. (2014)
access to drinking water, source: Hsu et al. (2014)
Safety and quality (country scale):
water quality index, source: Srebotnjak et al. (2012)
flood frequency index, source: Center for H et al. (2005)
Management (country and river basin scale):
World governance index, source: Kaufmann et al., (2010)
transboundary legal framework, source: http://twap-rivers.org
transboundary political tension, source: http://twap-rivers.org
Weighting of Indices - Example Gain et al. 2016 (view table)
There is not a uniform rule on how to weight indicators in a aggregated index. The weighting for the global water security index (Gain et al., 2016), for example, was defined based on qualitative estimations, eg. a higher relevance was given to availability compared to the other indicators.
→ Self-study question: Do you think these weights are appropriate for your country/region? Why?
Urban Water Security – Example: Bangkok, Babel et al., 2020
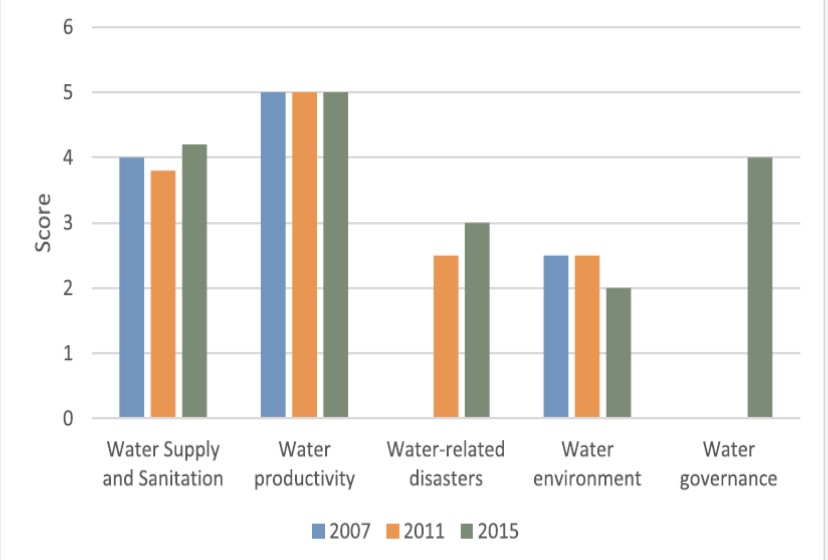
Urban Water Security (Babel et al., 2020).