5.3 Semi-quantitative and quantitative assessment tools
5.3.1 Flammini et al, 2014: Walking the Nexus Talk – The Nexus Rapid Appraisal Tool (FAO)
- Conduct a semi-quantitative context analysis based on existing data and indicators (from international organisations) describing the interconnections between the WEF sectors
- Evaluate the performance of a technical or policy interventions
- For stakeholders: Used to quantify bio-economic pressures, and benchmarks are defined in participatory processes
The FAO proposes a method to carry out a WEF Nexus assessment in order to:
- Understand the interconnections between water, energy and food systems in a given context
- Evaluate the performance of a technical or policy interventions
The overall objective of this WEF Nexus assessment is to inform Nexus-related responses in terms of strategies, policy measures, planning and institutional set-up or interventions.Given that a lack of data is often a barrier for assessing the Nexus, the FAO proposes a rapid appraisal based on indicators using data already collected at the national (or sub-national) level and available from international organisations. Based on this methodology, the FAO prepared an interactive tool “Nexus Assessment 1.0“ (included in the overview matrix under the “governing“ level) which aims at quantitatively assessing the Nexus as well as possible interventions.
5.3.2 FAO Walking the Nexus Talk: Assessing the Water-Energy-Food Nexus – Context Analysis
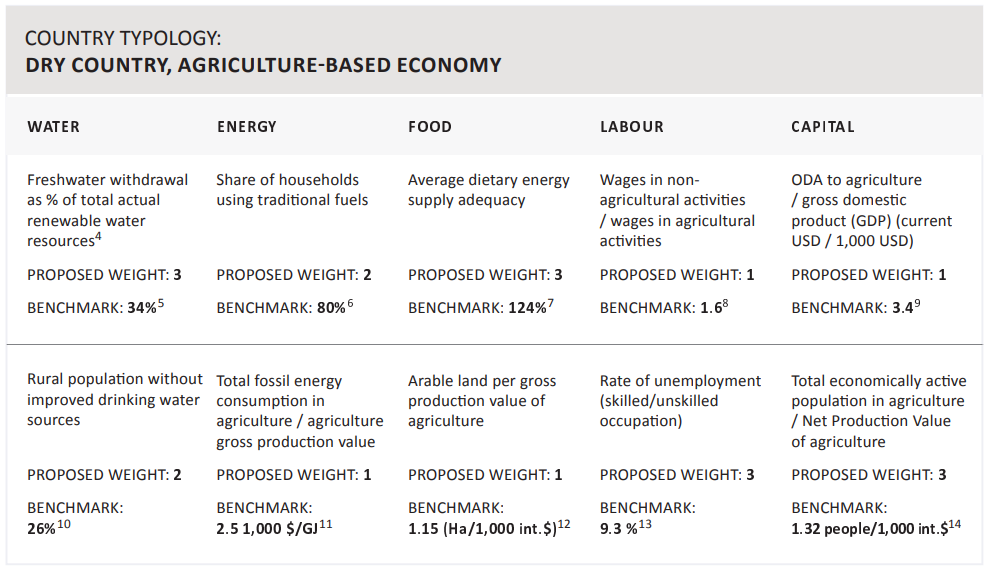
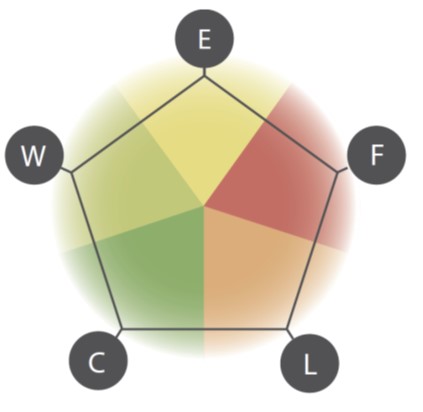
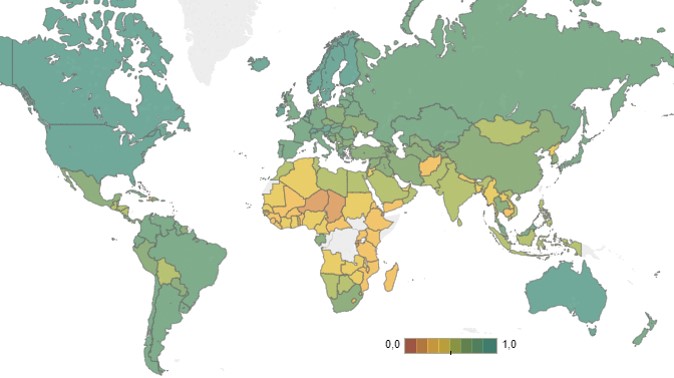
Figure left: The colors are the result of the difference between the measured indicators and the benchmark values.
Yellow = the sustainability of the context is similar to the reference
Green = is higher than the reference
Red = is lower than the reference
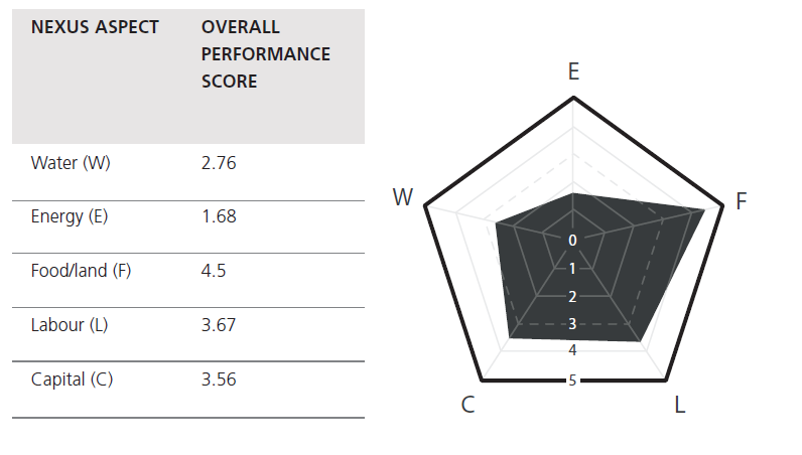
5.3.3 Nexus Rapid Appraisal Tool: On-grid wind energy for desalination
 Flammini et al., 2014
5 = high impact on Nexus aspect; 1 = little impact on Nexus aspect; 0 = no information
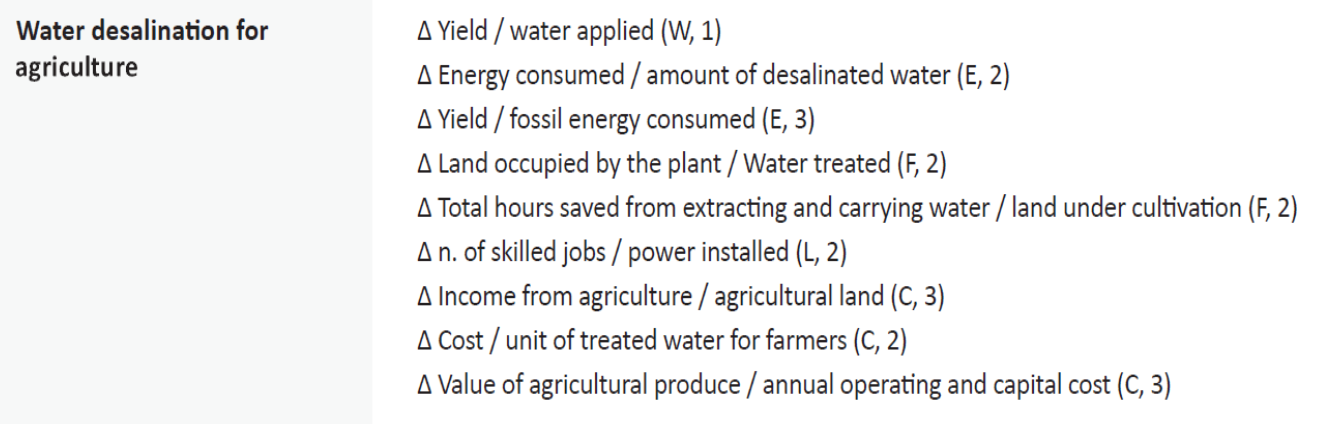
Flammini et al. (2014) used spider diagrams to illustrate the impact of an intervention on Water (W), Energy (E), Food/Land (F), Labour (L) and Capital (C). Each receives a performance score on a scale from 1 (centre) to 5 (outer). A high score indicates that the intervention has a high impact on the respective Nexus component, while a score close to 1 means the impact is low. 0 means that the intervention was not assessed for that particular Nexus component. The area size of the polygon is a measure of the overall impact of the intervention. The smaller the size of the polygon, the smaller the impact of the intervention on the Nexus aspects.
This figure shows the example of an intervention. The results indicate that the specific intervention “On-grid wind energy for water desalination for agriculture” has a very low impact on energy resources (it is using renewable energy and energy is used efficiently), a low impact on water resources (it is using no freshwater and the treated water is transformed efficiently into food), a high impact on food/land (in this case because the area occupied by the plant was considered, and land use is not efficient) and it is using labour and capital quite efficiently.
All these ‘efficiency considerations’ are assessed from a Nexus resource perspective, meaning how much of the specific resource is needed per unit of one or more of the other resources (e.g. how much energy per unit of water, how much money per unit of water, how much labour per unit of energy, etc.). The highest impact, according to the diagram, is on food/land. The overall performance of the intervention is combined into one single index, which corresponds to the area of the polygon on the spider chart. For example, in this case the overall performance is 25.6.
5.3.4 Indicators, impact and proposed weights
 Flammini et al., 2014
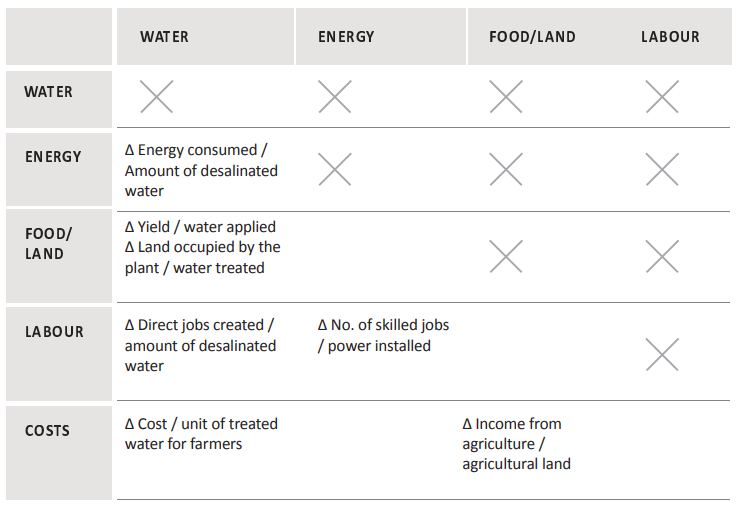
5.3.5 Nexus Rapid Appraisal Tool: Comparison
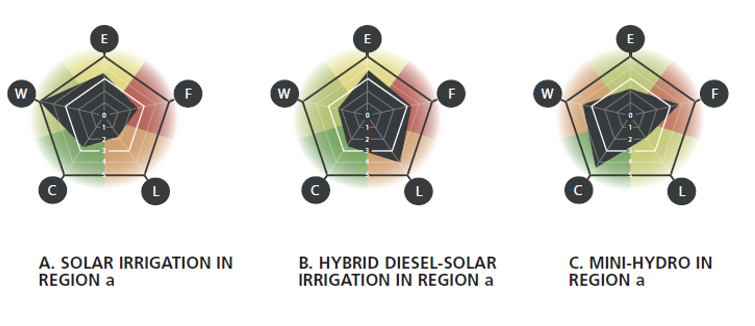
Flammini et al., 2014
With this method, different interventions can be easily compared to support decision-making. Three examples of interventions and their respective impacts on Nexus aspects are presented. This (semi-)quantitative assessment does not suggest which interventions are better than others in absolute terms, but it does highlight the trade-offs and for which aspects the intervention is adding pressure to the different components of the system.
5.3.6 The Pardee RAND Food-Energy-Water Index
- The aggregated index evaluates overall FEW Security based on FEW availability and accessibility indicators for the National scale
- Uses normalised scores from 0 (worst) to 1 (best)
Willis et al., 2016
The RAND Corporation developed the Pardee RAND Food-Energy-Water Security Index to provide information to development agencies and efforts focused on food, energy, and water resources. The index can be accessed online through an interactive (RAND website) that allows exploration of the data through maps and charts or downloading of the data for offline analysis.
As introduced to in Learning Units 2, 3, and 4 on the WEF securities, this index combines wef security indices to evaluate the supply and accessibility of resources at country level.
The Pardee RAND FEW index provides a standardized, quantitative and transparent estimation of the food, energy and water securities that can be easily used by policymakers, the development community, scientists, and the public interested in improving human development worldwide.
This online resource is available at: https://www.prgs.edu/pardee-initiative/food-energy-water/interactive-index.html
5.3.7 Pardee RAND FEW Index: WEF Security Indicators (view table)
The section above shows the WEF security indicators used to calculate the RAND FEW index. It is comprised of three sub-indices for food, energy and water. The index combines these sub-indices using an unweighted, geometric mean. To calculate the subindices, they used the dimensions Accessibility and Availability.
Overview of Dimensions
Availability refers to the overall National availability of resources to support needs for dietary requirements, sanitation, energy and productivity. However, the distribution of those resources across society is also an important consideration. Accessibility therefore additionally looks at the percentage of population with access to resources. For the water sub-index, they additionally used the Index on Water Adaptive capacity.
In the following sections, details are given related to the indices:
Food accessibility: Domestic Food Price Level Index— ratio of the food purchasing power parity by the general purchasing power parity, this indicator reflects economic access to food.
Energy availability: Benchmark value for per capita electricity consumption: 4,000 kilowatt-hours (kWh) per capita is the level required to meet basic human needs (Pasternak, 2000; Steinberger and Roberts, 2009).
They measure the availability of water resources by comparing country-wide total water withdrawals for municipal uses with water requirements for basic municipal purposes. Gleick (1996) calculated the per capita minimum level of water used for cooking, heating, and sanitation (i.e., municipal purposes) to be 50 liters per capita per day. More water withdrawals relative to basic requirements indicate greater security and more support for economic activities. This measure does not consider industrial or agricultural water use or requirements, as water use in these sectors is highly variable across countries, depending on the mix of economic activity and level and efficiency of irrigation for agriculture.
Water availability: The water availability sub-index normalizes per capita average municipal water use by 200 liters per day. Thus, any country with a ratio of water use to water requirements greater than four is given a value of 1.0. This level of water use is twice the standard 100 liters per day requirement for basic uses, and four times the bare minimum levels for cooking, eating, and sanitation of 50 liters per capita per day (Gleick, 1996). Normalizing by a level greater than the 100 liters per day standard helps account for the uneven distribution of water across countries and builds in inefficiencies in distribution into the index.
They evaluated the total per capita internally available renewable water. The internally available water includes the sum of internal renewable water resources and external actual renewable water resources. It corresponds to the maximum yearly amount of water actually available for a country at a given moment. This excludes any return flow from agriculture or wastewater.
5.3.8 The SDG Index 2021 and Dashboards
17 SDGs – 88 indicators in 2018
Uses scores from 0 (worst) to 100 (best) %
Uses equal weights
The annual SDG Index provides a standardized, quantitative, transparent and scalable composite measure of SDG baselines for 149 countries with sufficient data across the goals.
The SDG Index and Dashboards Report the performance of countries on the Sustainable Development Goals (SDGs). A data visualisation tool has been developed allowing users to compare rapidly their country results to others. Additional monitoring tools and analyses have been developed by (SDSN for Africa) and cities in the United-States using a similar approach and methodology.
Five criteria for indicator selection were used to determine suitable metrics for inclusion in the global SDG Index and Dashboards:
-
Global relevance and applicability to a broad range of country settings: The indicators are relevant for monitoring achievement of the SDGs and applicable to the entire continent. They are internationally comparable and allow for direct comparison of performance across countries. In particular, they allow for the definition of quantitative performance thresholds that signify SDG achievement.
-
Statistical adequacy: The indicators selected represent valid and reliable measures.
-
Timeliness: The indicators selected are up to date and published on a reasonably prompt schedule.
-
Data quality: Data series represent the best available measure for a specific issue, and derive from official national or international sources (e.g. national statistical offices or international organizations) or other reputable sources, such as peer-reviewed publications. No imputations of self-reported national estimates are included.
-
Coverage: Data have to be available for at least 80% of the 149 UN Member States with a national population greater than 1 million.
References
Flammini, A., Puri, M., Pluschke, L. & Dubois, O (2014), ‘Walking the Nexus Talk: Assessing the Water-Energy-Food Nexus in the Context of the Sustainable Energy for All Initiative’, Food and Agriculture Organization of the United Nations, Rome. Available at: http://www.fao.org/publications/card/en/c/f065f1d5-2dda-4df7-8df3-4defb5a098c8/
Sachs, J., Kroll, C., Lafortune, G., Fuller, G., Woelm, F. (2021). The Decade of Action for the Sustainable Development Goals: Sustainable Development Report 2021. Cambridge: Cambridge University Press. https://www.sdgindex.org/
Lafortune, G.; Fuller, G.; Moreno, J.; Schmidt-Traub, G. and Kroll,C. 2018. SDG Index and Dashboards Detailed Methodological paper. https://raw.githubusercontent.com/sdsna/2018GlobalIndex/master/2018GlobalIndexMethodology.pdf
Schmidt-Traub, Guido & Kroll, Christian & Teksoz, Katerina & Durand-Delacre, David & Sachs, Jeffrey. (2017). National baselines for the Sustainable Development Goals assessed in the SDG Index and Dashboards. Nature Geoscience. 10. 10.1038/ngeo2985.
Willis, H.H., Groves, D.G., Ringel, J.S., Mao, Z., Efron, S. & Abbott, M. (2016), ‘Developing the Pardee RAND Food-Energy-Water Security Index: Towards a Global Standardized, Quantitative, and Transparent Resource Assessment’, RAND Corporation, Santa Monica, Calif. https://www.rand.org/pubs/tools/TL165.html