4.3 Food Security Measurement Frameworks: SoA
4.3.1 Food Security Measurement Frameworks: SoA (view table)
Different approaches have been developed to assess food security. These depend on the purpose, spatio-temporal scale and data availability. Most of these metrics use food security dimensions and indicators. We encourage the readers to refer to Jones et al. (2013) and Pangaribowo et al. (2013), who provide comprehensive reviews about different food security assessment approaches.
4.3.2 Food Security Index, FAO (2006)
FAO (2006).
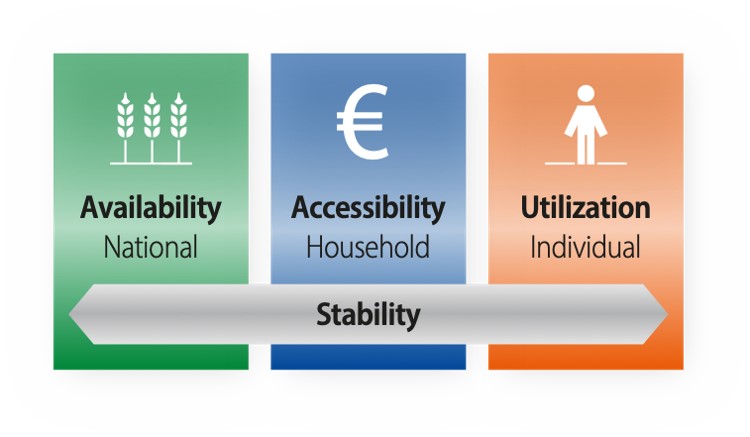
FAO (2006) used the most common four dimensions: availability, accessibility, utilization, and stability. Definitions of the four dimensions can be found in FAO, 2006 and 2008 and recent publications Gil et al., 2019; El Bilali et al., 2019, Peng and Berry, 2019, Anderson, 2019:
-
Food availability focuses on the supply side and expresses the availability of sufficient food quantities-produced domestically and imported. Food availability measures do show the household’s food security.
-
Accessibility reflects not only the ability to transport food to consumers (physical access) but also the latter’s purchasing power (economic access) to buy sufficient, nutritious, and preferred (sociocultural access) food.
-
Food utilization expands food security dimensions to cover non-food inputs. It addresses the adequacy of an individual’s quantity and quality dietary intake to reach a state of nutritional well-being.
-
Stability deals with the ability of a population, household or nation to cope with both the man-made (e.g. political instability, economic crises, rising prices, and wars) and the climatic (e.g. adverse weather conditions) shocks that could impact the food security status. In other words, stability is correlated to the availability, access and utilization dimensions.
While the availability dimension often refers to the national level, accessibility and utilization involve the household and individuals’ levels, respectively. The stability is considered to be the time dimension that involves all levels (Peng and Berry, 2019). Fundamentally, the four dimensions must be achieved simultaneously for maintain full food security. According to Gil et al., (2019), the four dimensions reflect different –but connected– food security aspects that should be aligned with the Sustainable Development Goal (SDG-2: End Hunger) targets.
Shortly after establishing the SDGs in 2015, literature argued that food security assessment should include one more dimension—Sustainability (e.g. Berry et al., 2015; El Bilali et al., 2018). Sustainability here refers to the long-term dimension, i.e. meeting the needs of the present while ensuring that future generations will be able to meet their own demands. Conventional food systems cause environmental, social, economic, and health issues. Such challenges, particularly on the long run, should be addressed through sustainability, ensuring that food systems are functioning in the long‐term in a manner that maintains the availability, access, utilization, and stability dimensions.
4.3.3 Global Food Security Index (GFSI)
Economist Intelligence Unit, 2012.
The Global Food Security Index (GFSI) was developed by The Economist Intelligence Unit (2012) and is a composite index that observes the trends in food security status at the country scale. The index ranks around 113 countries’ performance towards achieving food security. GFSI addresses three dimensions affordability, availability and quality and safety, using different weights: i.e. affordability 40%, availability, 44%, and quality and safety 16%.
According to Pangaribowo et al. (2013), the affordability and quality and safety dimensions of the GFSI are similar to the accessibility and utilization dimensions defined by FAO. They use 33 indicators and sub-indicators, addressing the three dimensions (6, 13, and 14 indicators for the affordability, availability, and quality and safety, respectively). The index incorporates quantitative (19) and qualitative (9) indicators.
Following is a list of the indicators and sub-indicators under their corresponding dimensions as defined by Thomas et al. (2017):
Indicators for affordability:
1. Food Consumption as a share of household expenditure
2. Proportion of population under global poverty line
3. GDP per capita at purchasing power parity (PPP)
4. Agricultural Import tariffs
5. Presence of food safety-net programmes (qualitative)
6. Access to financing for farmers (qualitative)
Indicators for availability:
1. Sufficiency of supply
1.1. Average food supply
1.2. Dependence on chronic food aid (qualitative)
2. Public expenditure on agricultural research & development
3. Agriculture infrastructure
3.1. Existence of adequate crop storage facilities (qualitative)
3.2. Road infrastructure
3.3. Port infrastructure
4. Volatility of agricultural production
5. Political stability risk
6. Corruption
7. Urban absorption capacity
8. Food loss
Indicators for quality and safety:
1. Diet diversification
2. Nutritional standards
2.1. National dietary guidelines (qualitative)
2.2. National nutrition plan or strategy (qualitative)
2.3. Nutrition monitoring and surveillance (qualitative)
3. Micronutrient availability
3.1. Dietary availability of vitamin A
3.2. Dietary availability of animal iron
3.3. Dietary availability of vegetal iron
4. Protein quality
5. Food safety
5.1. Agency to ensure the safety and health of food (qualitative)
5.2. Percentage of population with access to potable water
5.3. Presence of formal grocery sector (qualitative)
4.3.4 FAO Prevalence of Undernourishment (PoU)
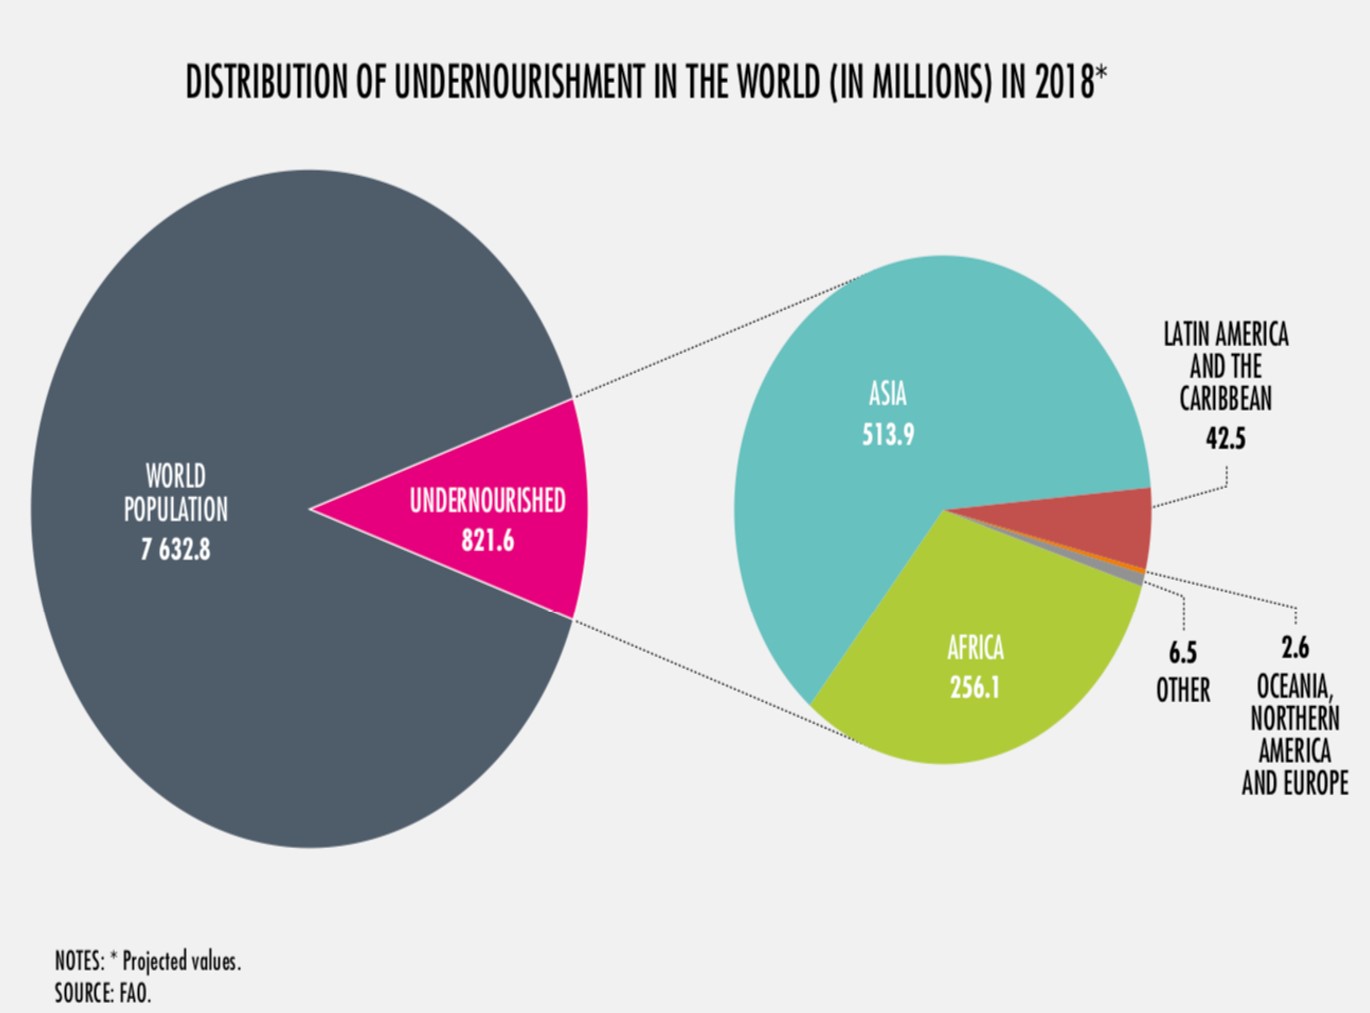
FAO Indicator the Prevalence of Undernourishment (PoU). Undernourishment is defined as “Food intake that is continuously insufficient to meet dietary energy requirements” (FAO, 2001). In other words, undernourishment indicates the individuals’ inability to obtain sufficient food in order to meet their daily energy requirements.
Although PoU was originally developed to monitor hunger as part of established Millennium Development Goals in 2000, it was adopted as an indicator for the SDG indicator 2.1.1 in 2015 (United Nations, 2015). PoU is defined as ”the proportion of the population whose habitual food consumption is insufficient to provide the dietary energy levels that are required to maintain a normal active and healthy life”, i.e. a proxy for food energy consumption (Pangaribowo et al., 2013). This indicator is measured by FAO and is produced annually at the national scale.
Based on the review of Jones et al. (2013), PoU focuses mainly on food availability—with limited coverage to accessibility—by combining three parameters, namely
- mean quantity of available calories for consumption,
- the inequality in access to those calories, and
- the minimum required amount of calories by the population (De Haen et al., 2011; Pangaribowo et al., 2013).
Despite that PoU is available for most countries, it has several drawbacks. First, the high dependency and sensitivity of the indicator on the three abovementioned parameters limits the robustness of the indicator (Naiken, 2002; De Haen et al., 2011).
Second, the indicator is criticized for its dependence on the calorie availability since the latter is considered to be insufficient variable for predicting nutritional development and mortality (Pangaribowo et al., 2013).
Third, the indicator assumes that the average dietary energy supply is equivalent to the distribution of calorie consumption among the population, ignoring information on food losses and distribution in the food balance sheets (Jones et al., 2013).
Fourth, Svedberg (2002) argues that large underestimation of people experiencing undernutrition is a result of aggregating the sex and age while calculating the minimum dietary requirements.
Fifth, the quality and accuracy of the data used in the food balance sheets—the source of calculating PoU—is questionable (Barrett, 2010).
For these reasons, the PoU índicator is considered to be insufficient to comprehensively assessing the food security status.
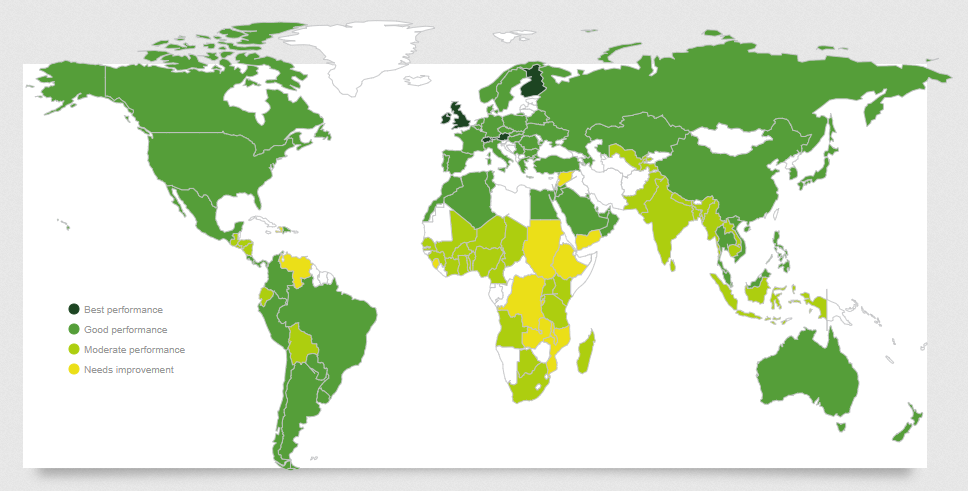
Following is an interactive map by FAO by which you could retrieve the number or percentage of undernourished people at the country scale: Go to Interactive Map.
References
4.3.1 Food Security Measurement Frameworks: SoA
- Jones, A.D., Ngure, F.M., Pelto, G. and Young, S.L., 2013. What are we assessing when we measure food security? A compendium and review of current metrics. Advances in Nutrition, 4(5), pp.481-505. https://doi.org/10.3945/an.113.004119
- Pangaribowo, Evita Hanie and Gerber, Nicolas and Torero, Maximo, Food and Nutrition Security Indicators: A Review (February 1, 2013). ZEF Working Paper No. 108, Available at SSRN: https://ssrn.com/abstract=2237992 or http://dx.doi.org/10.2139/ssrn.2237992
4.3.2 Food Security Index, FAO (2006)
- FAO, 2006, Food Security. Policy Brief, Issue 2. June 2006.http://www.fao.org/fileadmin/templates/faoitaly/documents/pdf/pdf_Food_Security_Cocept_Note.pdf.
- FAO, 2008. Food Security Information for Action: Practical Guides. An Introduction to the Basic Concepts of Food. Security EC - FAO Food Security Programme. http://www.fao.org/3/a-al936e.pdf
- Gil, J.D.B., Reidsma, P., Giller, K., Todman, L., Whitmore, A. and van Ittersum, M., 2019. Sustainable development goal 2: Improved targets and indicators for agriculture and food security. Ambio, 48(7), pp.685-698.https://doi.org/10.1007/s13280-018-1101-4
- El Bilali, H., Callenius, C., Strassner, C. and Probst, L., 2019. Food and nutrition security and sustainability transitions in food systems. Food and Energy Security, 8(2), p.e00154. https://doi.org/10.1002/fes3.154
- Peng, W., & Berry, E. M. (2019). The Concept of Food Security. 2, 1-7. https://doi.org/10.1016/B978-0-08-100596-5.22314-7
- Anderson., 2019. Concepts of Stability in Food Security. In: Ferranti, P., Berry, E.M., Anderson, J.R. (Eds.), Encyclopedia of Food Security and Sustainability, vol. 2, pp. 8–15. Elsevier, https://doi.org/10.1016/B978-0-08-100596-5.22315-9
4.3.3 Global Food Security Index (GFSI)
- The Economists group, 2002. Trade and Food Security: Conceptualizing the Linkages, Rome, 11-12 July 2002. https://foodsecurityindex.eiu.com/
- Pangaribowo, E.H., Gerber, N. and Torero, M., 2013. Food and nutrition security indicators: a review. https://www.wecr.wur.nl/WECRGeneral/FoodSecurePublications/05_Pangaribowo Gerber Torero_FNS Indicators.pdf
- Thomas A.-C., D’Hombres B., Casubolo C., Saisana M., Kayitakire F., 2017. The use of the Global Food Security Index to inform the situation in food insecure countries, EUR 28885 EN, JRC, Ispra, 2017, ISBN 978-92-79-76681-7, https://doi.org/10.2760/83356
4.3.4 FAO Prevalence of Undernourishment (PoU)
- FAO, 2001. The State of Food Insecurity in the World 2001. FAO, Rome. , Available at: http://www.fao.org/3/y1500e/y1500e00.htm
- United Nation, 2015. Sustainable Development Goals. Available from: https://sdgs.un.org/goals/goal2
- Pangaribowo, E.H., Gerber, N. and Torero, M., 2013. Food and nutrition security indicators: a review. https://www.wecr.wur.nl/WECRGeneral/FoodSecurePublications/05_Pangaribowo Gerber Torero_FNS Indicators.pdf
- Jones, A.D., Ngure, F.M., Pelto, G. and Young, S.L., 2013. What are we assessing when we measure food security? A compendium and review of current metrics. Advances in Nutrition, 4(5), pp.481-505. https://doi.org/10.3945/an.113.004119
- De Haen, H., Klasen, S. and Qaim, M., 2011. What do we really know? Metrics for food insecurity and undernutrition. Food Policy, 36(6), pp.760-769. https://doi.org/10.1016/j.foodpol.2011.08.003
- Naiken, L., 2002. FAO methodology for estimating the prevalence of undernourishment. Proceedings of the International Scientific Symposium on Measurement and Assessment of Food Deprivation and Undernutrition, Rome, Italy. http://www.fao.org/3/Y4249E/y4249e06.htm
- Svedberg, P., 2002. Undernutrition overestimated. Economic Development and Cultural Change, 51(1), pp.5-36. https://www.journals.uchicago.edu/doi/abs/10.1086/345308?journalCode=edcc
- Barrett, C.B., 2010. Measuring food insecurity. Science, 327(5967), pp.825-828, https://doi.org/10.1126/science.1182768